Researcher(s)
Supervisor(s)
Laboratory
Abstract
Ceiling fans are widely used as a means of providing thermal comfort to occupants in an indoor environment all around the world and it contributes to a significant portion of annual energy consumption throughout the world. A number of standards for efficiency analysis of ceiling fans are employed by many countries, with the intention of making ceiling fans more efficient. In these test standards, different test setups have been utilised. Work performed on analysis of the effect of these setups on performance evaluation of ceiling fans is currently unavailable. Further, there is a scarcity of research work performed on analysis of flow characteristics around a rotating ceiling fan. Understanding the proper flow around a rotating ceiling fan can lead to designing more efficient fan blades, which can lead to significant energy savings. Therefore, this study is split into two sections. In section one, a systematic investigation of the different test standards available for performance analysis of ceiling fans is performed, namely standards considered are ANSI/AMCA 230 standard, IEC 60879: 1986 standard, SLS 1600:2011 standard and Energy Star v1.2 standard for performance testing of ceiling fans. In section two, a flow physics analysis around a ceiling fan is carried out. For these, a CFD model was developed and it was validated using experimental results. The analysis of test standards was carried out by using a RANS method whereas the analysis of flow physics was carried out by using LES method. The numerical results obtained shows that the test cylinder present in some of the standards mentioned above, does not have a significant impact on the measured performance of the tested ceiling fan (variation is less than 2%), therefore having a test cylinder at an extra cost have no benefit on the measured results of ceiling fan testing. On the other hand, maintaining test cylinders for every fan size would impart a significant cost on the testing process and having a cylinder which is not correctly aligned can lead to inaccurate readings. From the flow results of the LES simulations, creation of two major vorticial structures is seen arising from the tip and the root of the blade. As these vorticial structures move further downward, more vortices were formed due to the action of these and the number of vortices keep growing with flow time, resulting the flow to become turbulent with the flow time. Furthermore, it was seen that the flow transition from laminar to turbulent occurred at the mid chord section, starting from the deflected section of the blade.
Keywords
Ceiling Fans, Test Standards, Energy Star, Efficiency, Thermal Comfort, Computational Fluid Dynamics
Results

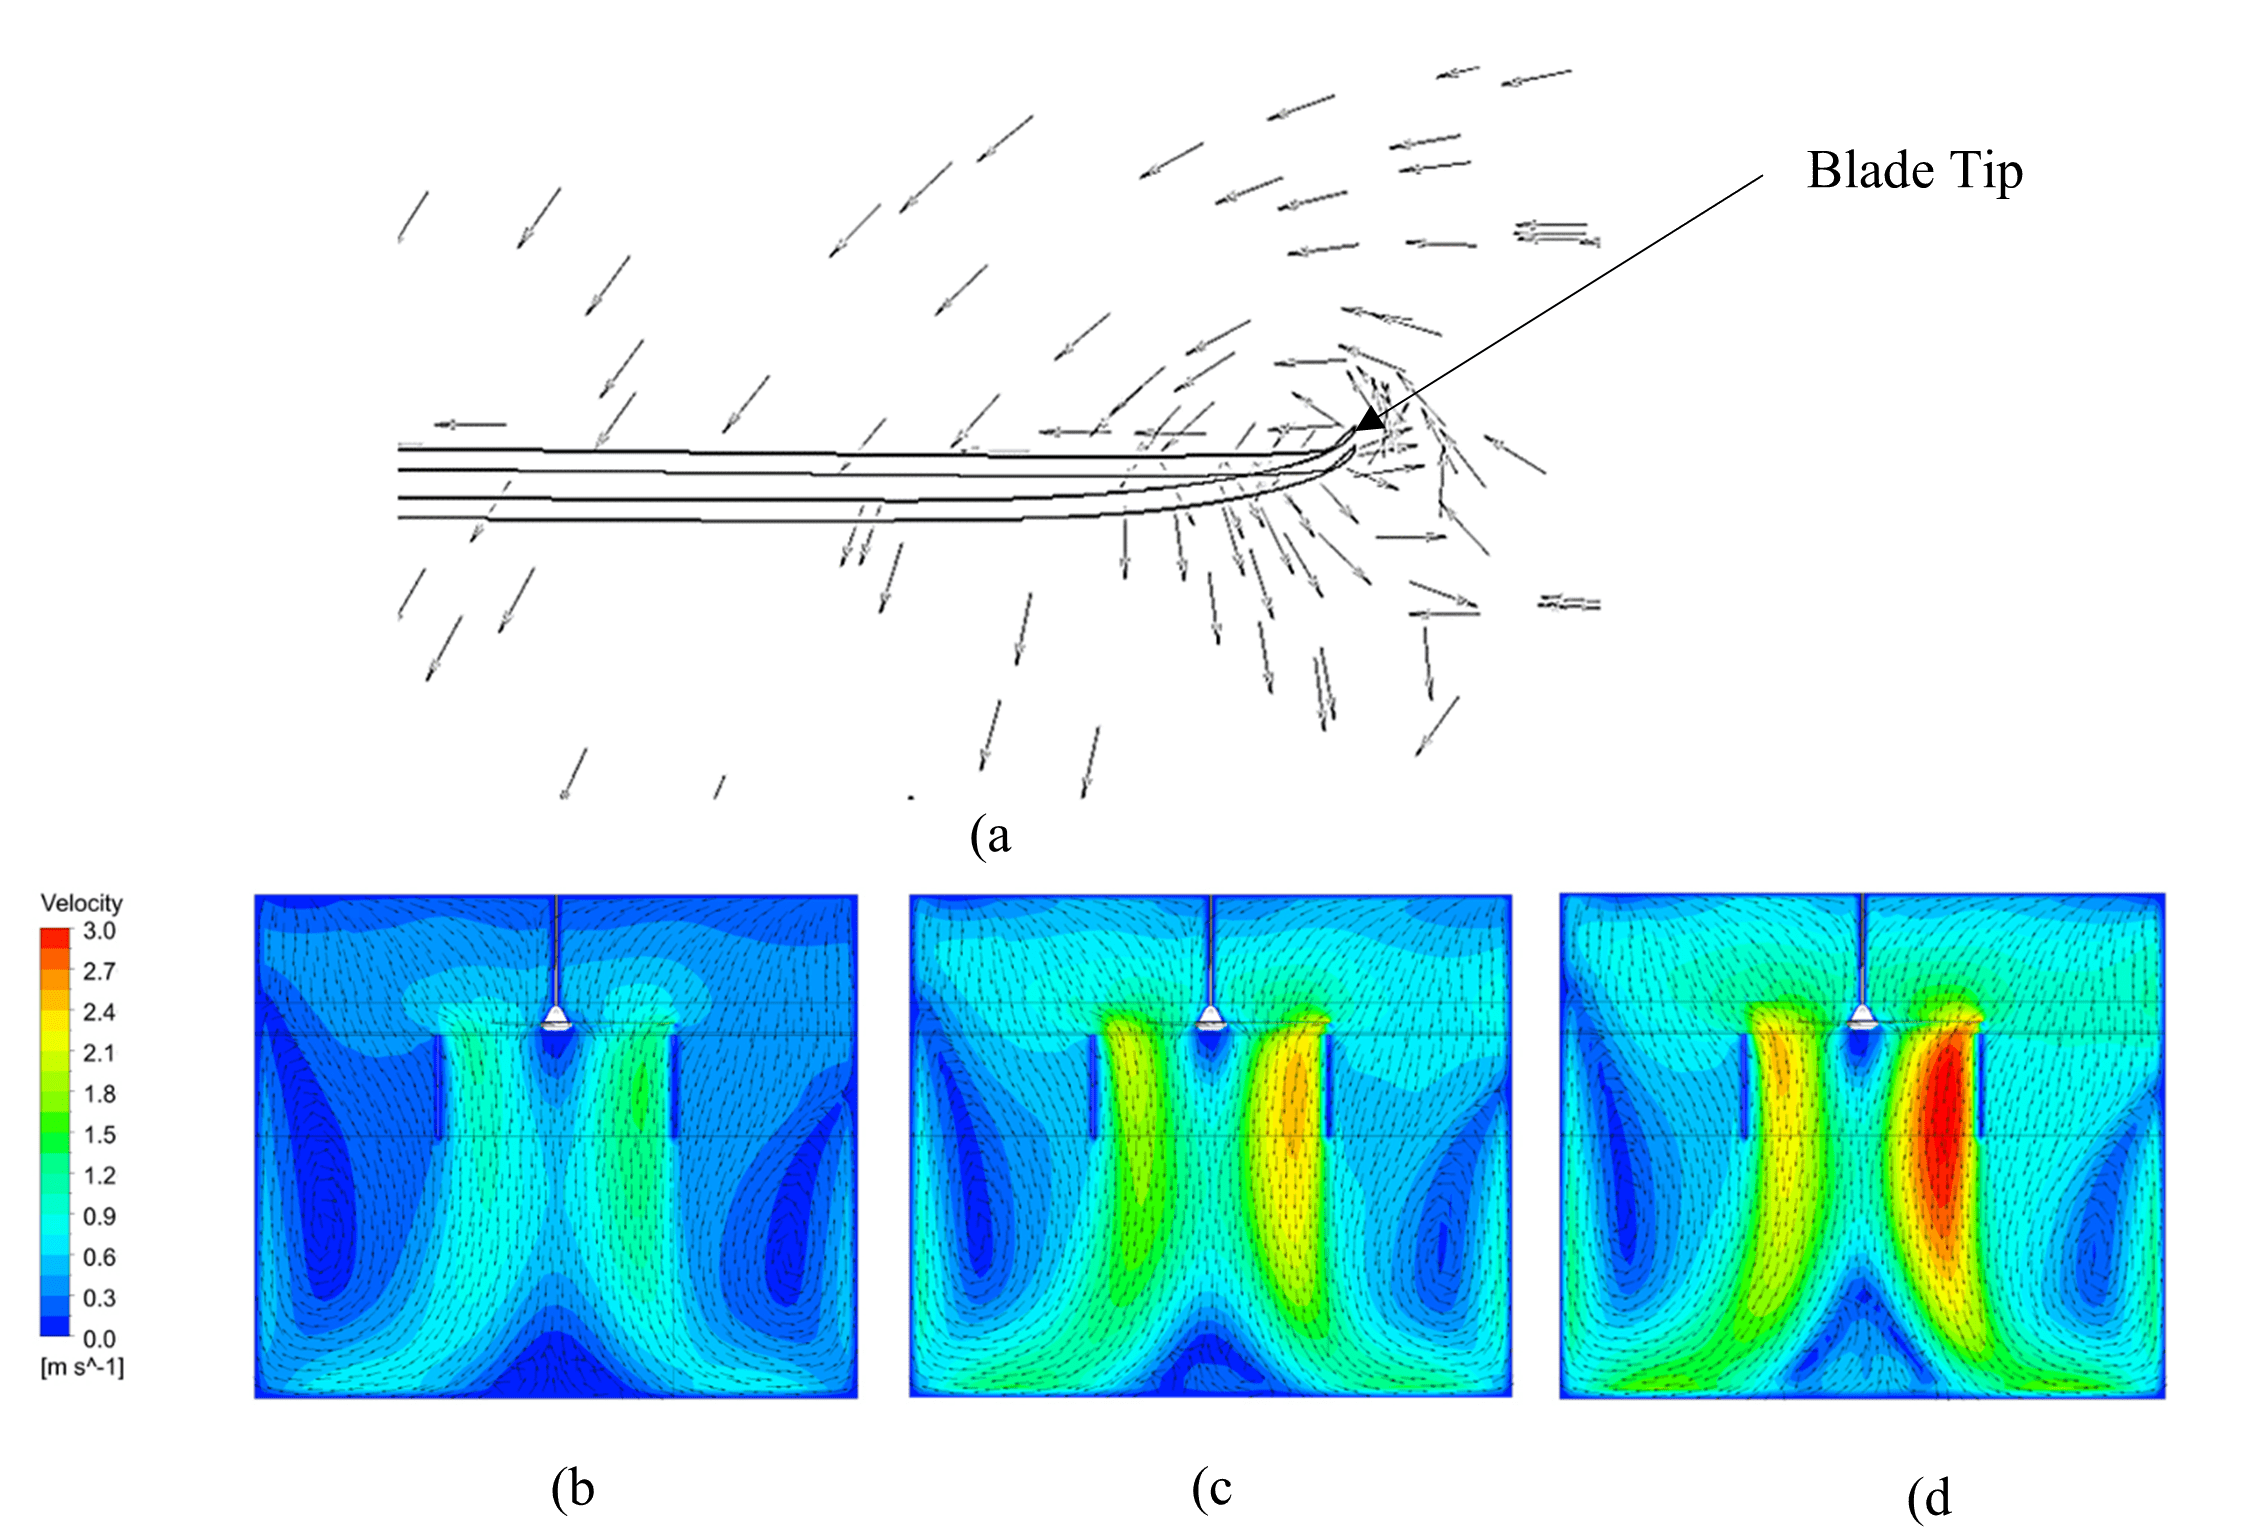
Figure 1. Generated velocity distributions (a) Vertex plot of tip vortices, (b) Generated velocity contours in mid plane at 129.2 RPM, (c) - Generated velocity contours in mid plane at 234.5 RPM, (d) – Generated velocity contours in mid plane at 287.2 RPM.
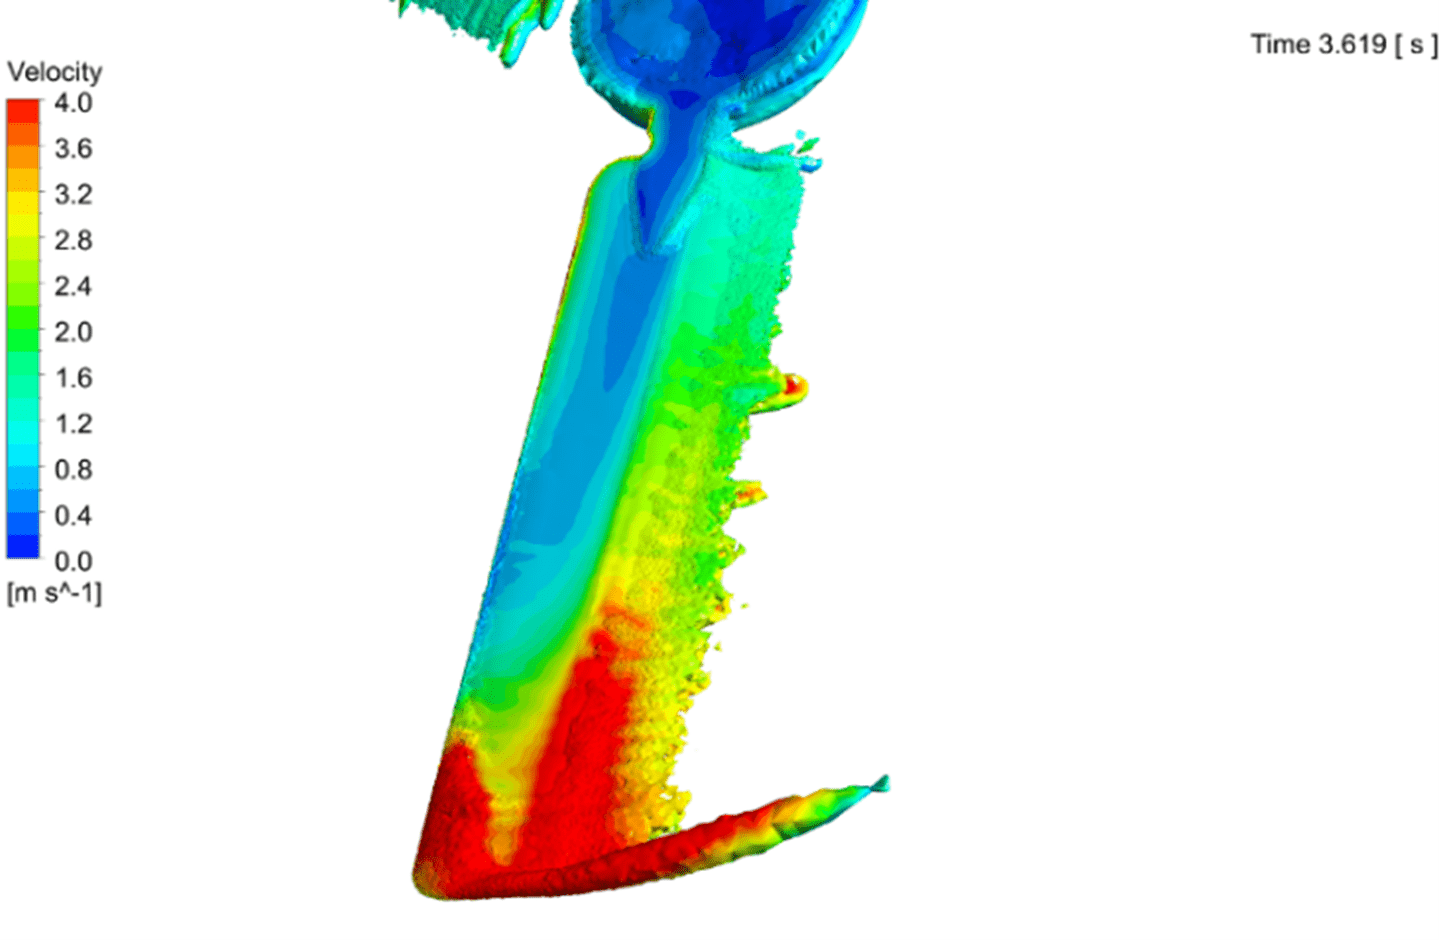
 Figure 2. Iso surface of vortex core region at Vorticity = 250 s-1 colored by velocity.
Publications
-
Casseer, D., & Ranasinghe, C. (2019). Assessment of Spallart Almaras Turbulence Model for Numerical Evaluation of Ceiling Fan Performance. Moratuwa Engineering Research Conference (MERCon) 2019 (pp. 577-582). Moratuwa, Sri Lanka: IEEE. DOI: 10.1109/MERCon.2019.8818888
-
Casseer, D., & Ranasinghe, C. (2020). An assessment on the test setups used for energy labeling of ceiling fans. Building Simulation. https://doi.org/10.1007/s12273-020-0725-z.


